From the Report Wizard page you can run the report and view the results at any time. This is also useful in setting up any new report as it will allow you to verify that the report meets your needs.
To run an existing report in e-Builder click its name. The results of the report will then be displayed on the screen.
- Open Reports.
- On the Reports page, click the Edit link next to the name of the report you want to edit. The Report Wizard displays.
- Click Run Report. The Report Results page displays.
- Open Reports.
- On the Reports page, click the name of the report you want to run again. The Report Results page displays.
- Click Re-Run Report. The Report Results page displays after the report is run again.
A project's Gantt chart can be printed from within the Reports module.
Only the Schedules and Tasks type of report can generate a Gantt Chart.
- Open Reports.
- On the Reports page, click the Edit link next to the name of the report you want to edit. The Report Wizard displays.
- Click Run Report. The Report Results page displays.
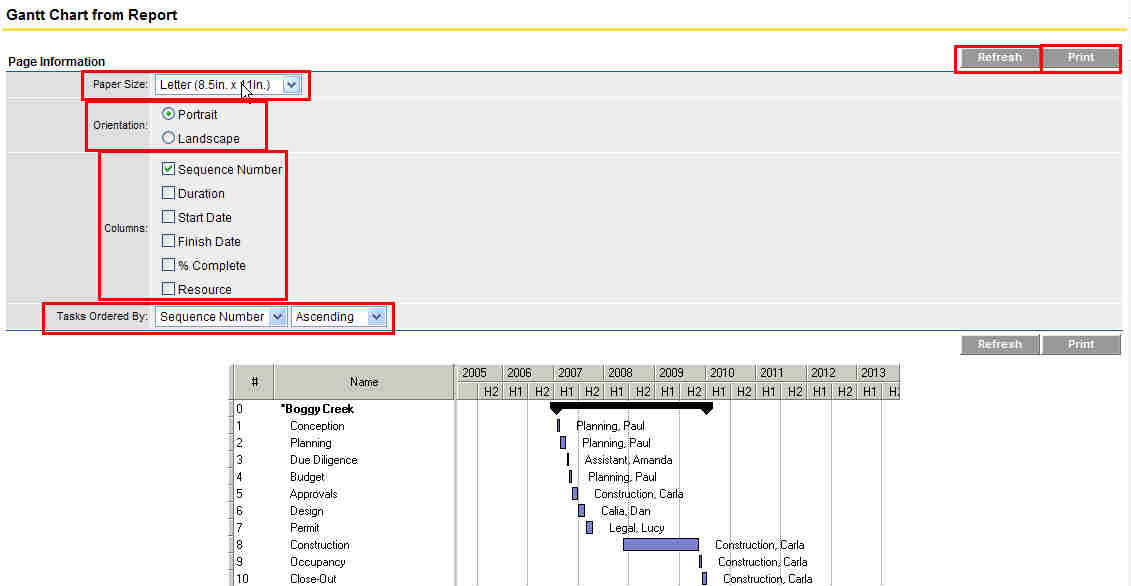
- To graphically view your schedule, click Gantt Chart. The Gantt Chart from Report window displays.
You will now be able to adjust the paper size and page layout of the print out. Add columns and order the tasks. Clicking the Refresh button will update the chart with any adjustments that you have made. The Print button will send the chart to your local printer.